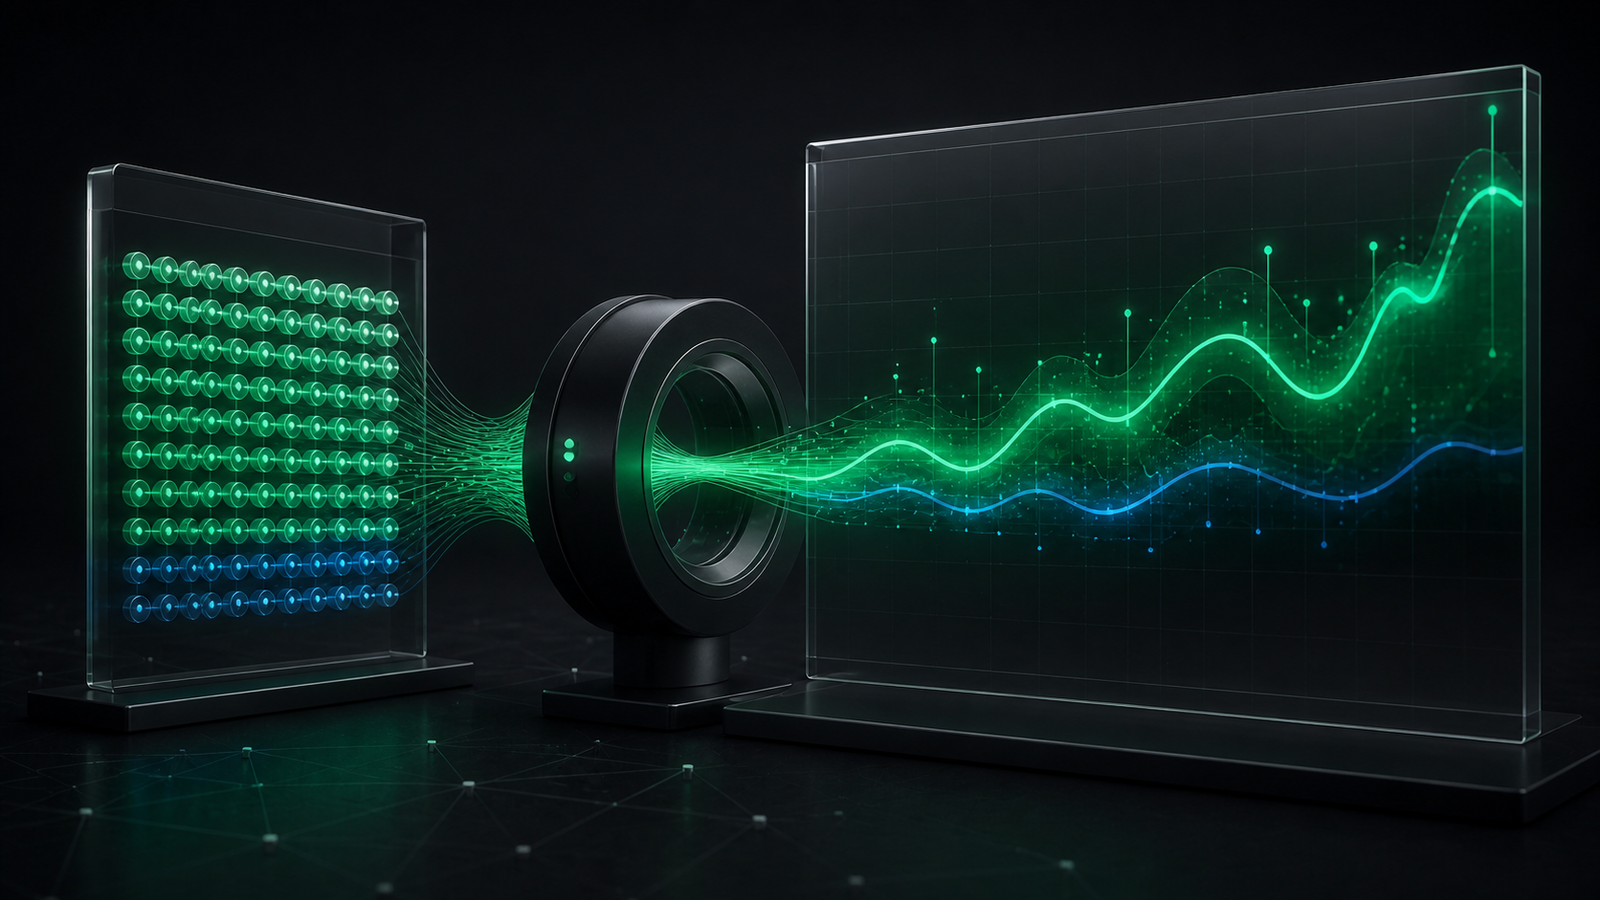


A poll and a prediction market can both produce a percentage, which makes them easy to place side by side. A poll might report that 54% of respondents support an outcome. A market might trade at 54¢ and be displayed as a 54% probability. The numbers look alike, but they are created by different processes and answer different questions.
The useful distinction is simple: a poll measures stated responses from a sample, while a market price reflects the terms on which participants are willing to trade. Neither number explains itself.
What a poll measures
A poll asks selected people a defined question during a defined period. The published percentage is an estimate based on their answers, the sample design, and the adjustments applied by the pollster. It is a snapshot of reported opinion or intention—not a price and not automatically a forecast of the final result.
The design determines the meaning
Two polls about the same event may differ because they sampled different populations, used different wording, contacted people through different channels, or collected answers on different dates. Those choices are not footnotes to the result. They define what the result represents.
- Population: Who was eligible to respond—adults, registered voters, likely voters, customers, or another group?
- Question wording: Was the outcome described neutrally, and were respondents offered the same choices?
- Fieldwork window: When were the responses collected, and what events happened before or after that period?
- Method and weighting: How were respondents reached, and how was the sample adjusted?
A poll percentage is best read as a measured snapshot with a specific population, question, method, and date attached.
What a market price measures
A prediction market does not ask every participant what they believe. It offers a contract with a defined payoff and lets participants buy or sell exposure. The displayed probability is derived from the current trading price. It shows where available buying and selling interest meets under that platform’s rules, fees, liquidity, and participant mix.
If a yes contract trades at 0.54, the interface may present that as a 54% probability. The conversion is intuitive, but the underlying object remains a tradable contract.

Why a market probability moves
A new poll can influence a market, but so can many other inputs: economic data, official filings, injuries, weather, court decisions, endorsements, platform-specific order flow, or a trader deciding that the current price offers attractive value. The market combines those actions into one changing quote without revealing a clean survey of participant beliefs.
- New information changes what some participants think the contract is worth.
- Those participants place, cancel, or accept orders at different prices.
- The available liquidity determines how far the next trade moves the displayed probability.
- Other traders respond, and the price continues to adjust as disagreement and risk appetite change.
The price is set at the margin
A market price is not the average belief of everyone watching the event. It is the price available at the margin: the level at which the next units can trade. A participant with strong conviction and substantial capital may affect the quote more than many observers who never place an order. That is a feature of a market, but it makes the number fundamentally different from a respondent share.
Similar percentages can answer different questions
Suppose a candidate receives 54% support in a national poll while a market shows a 54% chance of winning. The poll is estimating current support under its sampling assumptions. The market is pricing the chance that a particular contract resolves yes. Electoral systems, turnout, geography, uncertainty, and the contract’s settlement rules can all separate those concepts.
- Level versus chance: A vote-share estimate is not the same as the probability of finishing first.
- Snapshot versus horizon: Current responses can change before the contract deadline.
- People versus capital: Poll respondents contribute answers; market participants contribute orders and take financial exposure.
- Sampling uncertainty versus pricing uncertainty: Each system has different sources of error and instability.
Use each signal for what it does well
Polls can provide a structured view of opinions across a defined population, including people who would never trade. Markets can update continuously, reward participants for acting on information, and compress disagreement into a tradable price. Those strengths are complementary. A careful analyst asks why the signals agree or disagree instead of treating one as a substitute for the other.
The most informative comparison often begins with the gap between them: what assumptions would make both numbers reasonable at the same time?
The same discipline applies when comparing prices in our markets overview: first identify what each number measures, then examine the gap.
A practical checklist for reading percentages
- Name the object: Is the number a respondent share, a forecast, a contract price, or something else?
- Read the definition: Who or what is being measured, and what exact outcome counts?
- Check the timestamp: Is the number a fieldwork snapshot, a recent trade, or a stale quote?
- Inspect the uncertainty: Review sample design for polls and liquidity, volume, and spread for markets.
- Compare like with like: Do not interpret two matching percentages as equivalent until their underlying questions align.
Percentages need provenance
A percentage becomes useful when you know where it came from. Polls turn sampled responses into estimates. Prediction markets turn trading decisions into prices. Both can illuminate uncertainty, and both can mislead when stripped of their method, timing, and definitions. Read the number—but read the machinery behind it too.